Coilover Shock Dyno Analysis And Performance Review
So, you're thinking about upgrading to coilovers or maybe just trying to squeeze the most performance out of your current setup? Great! Understanding how your coilovers actually perform is crucial, and that's where a shock dyno comes in. Forget subjective seat-of-the-pants feel; a dyno gives us cold, hard data to work with. This article will walk you through the basics of coilover shock dyno analysis and how to interpret the results. Think of this as a masterclass in understanding your suspension's soul.
What is a Shock Dyno and Why Do We Need It?
A shock dyno is a machine that simulates the motion of a vehicle's suspension, allowing us to measure the force generated by the shock absorber at different speeds and displacements. Imagine a controlled environment where we can repeatedly compress and extend the shock, recording exactly how it resists that movement. Without a dyno, you're essentially guessing at how your shocks are performing. Are they properly damped? Are they consistent? Are they matched left-to-right? A dyno answers these questions definitively.
Why is this important? Well, shock absorbers control the rate at which your suspension compresses and rebounds. Proper damping is crucial for maintaining tire contact with the road, minimizing body roll, and providing a comfortable and controlled ride. Insufficient damping leads to bouncing, excessive body roll, and a loss of grip. Too much damping can make the ride harsh, reduce compliance over bumps, and potentially cause wheel hop. The dyno helps us find that sweet spot.
Key Concepts: Force, Velocity, and Displacement
Before diving into the dyno graphs, let's define some key terms:
- Force (measured in pounds-force or Newtons): The resistance the shock absorber provides to movement. Higher force means more resistance.
- Velocity (measured in inches per second or meters per second): The speed at which the shock absorber is being compressed or extended. This is often referred to as shaft speed.
- Displacement (measured in inches or millimeters): The amount the shock absorber is compressed or extended.
The dyno plots these values against each other, typically showing force versus velocity. This graph reveals the shock's damping characteristics at various shaft speeds.
Types of Shock Dynos
There are two main types of shock dynos:
- Inertia Dynos: These dynos use a rotating mass (the inertia) to simulate the force on the shock. They're generally simpler and less expensive than hydraulic dynos. They are primarily used for a single, constant velocity sweep.
- Hydraulic Dynos: These dynos use hydraulic cylinders to precisely control the motion of the shock absorber. They offer greater control over velocity and displacement profiles, allowing for more detailed testing. Hydraulic Dynos are more expensive but provide more accurate data.
Hydraulic dynos are generally preferred for professional tuning and development due to their accuracy and versatility. However, inertia dynos can still provide valuable information for basic shock assessment.
Understanding the Dyno Graph
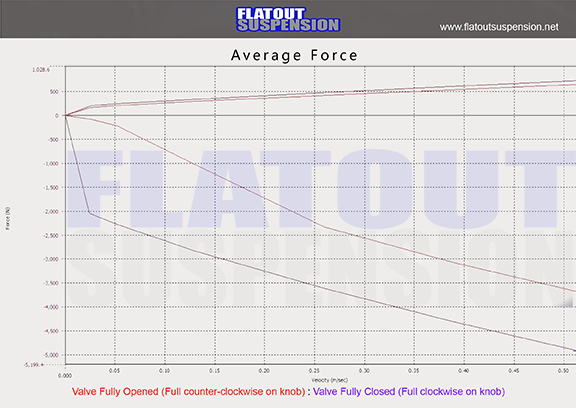
The most common dyno graph plots force (typically on the Y-axis) against velocity (typically on the X-axis). Let's break down what you're seeing:
- Compression (Bump) Curve: This curve represents the force generated when the shock is being compressed. It's usually plotted in the lower portion of the graph.
- Rebound Curve: This curve represents the force generated when the shock is extending. It's usually plotted in the upper portion of the graph.
- The Slope of the Curve: A steeper slope indicates more damping force at a given velocity.
- Linearity: Ideally, you want a relatively linear curve. This means the damping force increases proportionally with velocity. Non-linear curves can indicate issues like cavitation or excessive stiction.
- Hysteresis: The area between the compression and rebound curves. A larger area indicates more energy being dissipated by the shock. Excessive hysteresis can contribute to overheating.
Look for smoothness in the curves. Jagged lines can indicate problems like excessive friction or cavitation (air bubbles forming in the oil). Also, pay attention to the shape of the curves at different velocities. A good shock will have a consistent and predictable response across the range of shaft speeds.
Digressive, Linear, and Progressive Damping
The shape of the force-velocity curve describes the damping characteristic of the shock. Let's look at three common types:
- Digressive: The damping force increases rapidly at low speeds, then plateaus or even decreases at higher speeds. This can provide good control over body roll but can feel harsh over small bumps at high speed. This curve is characterized by a "bend" in the graph where the slope decreases.
- Linear: The damping force increases proportionally with velocity. This provides a predictable and consistent response across a wide range of speeds.
- Progressive: The damping force increases more rapidly as velocity increases. This can provide a plush ride at low speeds and good control at high speeds, but can feel overly stiff.
The ideal damping characteristic depends on the specific application and the vehicle's suspension geometry.
Analyzing Coilover Dyno Results: What to Look For
When analyzing dyno results, consider these factors:
- Consistency: Run the dyno multiple times to ensure the results are consistent. Inconsistent results indicate a problem with the shock, such as a leak or internal damage.
- Left-to-Right Matching: Compare the dyno graphs of the left and right shocks. They should be very similar. Significant differences indicate a problem with one of the shocks or incorrect adjustment.
- Adjustability Range: If your coilovers have adjustable damping, test them at different settings to see how the damping force changes. This allows you to fine-tune the shocks to your specific needs. Ensure the adjuster clicks are producing consistent and predictable changes on the dyno.
- Correlation to Track Performance: Ultimately, the goal is to improve track performance. Correlate your dyno results with your on-track experience. Did the changes you made based on the dyno improve lap times and handling?
A common practice is to overlay the dyno graphs from different shock settings (e.g., softest, mid-range, and stiffest) to visualize the adjustability range. This helps determine if the adjuster is actually making meaningful changes to the damping force.
Common Issues Revealed by a Dyno
A shock dyno can reveal a number of potential issues:
- Leaks: A leaking shock will lose damping force over time. This will be evident as a decrease in force during repeated dyno runs.
- Cavitation: Air bubbles in the oil can cause inconsistent damping and a loss of performance. The dyno graph may show jagged lines or a sudden drop in force.
- Excessive Friction (Stiction): Excessive friction in the shock can cause a harsh ride and inconsistent performance. The dyno graph may show a large hysteresis area.
- Bent Shaft: A bent shaft can cause binding and inconsistent damping.
- Incorrect Valving: The valving inside the shock controls the damping force. Incorrect valving can result in over- or under-damped performance.
Making Adjustments and Re-Dynoing
The real power of a shock dyno lies in its ability to help you make informed adjustments to your coilovers. Whether you're adjusting the damping settings or re-valving the shocks, the dyno provides immediate feedback on the effects of your changes. Always re-dyno after making any adjustments to verify the changes and ensure they are within acceptable limits.
If you're re-valving your shocks, you can use the dyno to test different valve configurations and identify the optimal setup for your application. This is a time-consuming process, but it can yield significant performance gains.
Conclusion
A shock dyno is an invaluable tool for understanding and optimizing your coilover performance. While it requires some technical knowledge to interpret the results, the information gained can lead to significant improvements in handling, comfort, and lap times. By understanding the key concepts, analyzing the dyno graphs, and making informed adjustments, you can unlock the full potential of your suspension system. It's not about chasing peak numbers on a graph, but understanding the *relationship* between force, velocity and displacement and how that translates to performance on the road or track. So, go forth, explore, and tune those shocks!