What Was The Price Of Gas In 2018
Understanding the fluctuations in gasoline prices is crucial for any car owner, especially those who enjoy DIY maintenance or modification. Knowing historical trends, like the average price of gas in 2018, allows you to better budget for your vehicle's operating costs, anticipate fuel expenses during road trips, and even make informed decisions about vehicle upgrades that impact fuel efficiency. While the information is retrospective, understanding *why* prices were what they were then can provide valuable insight into current market dynamics.
Average Gas Prices in 2018: A Look Back
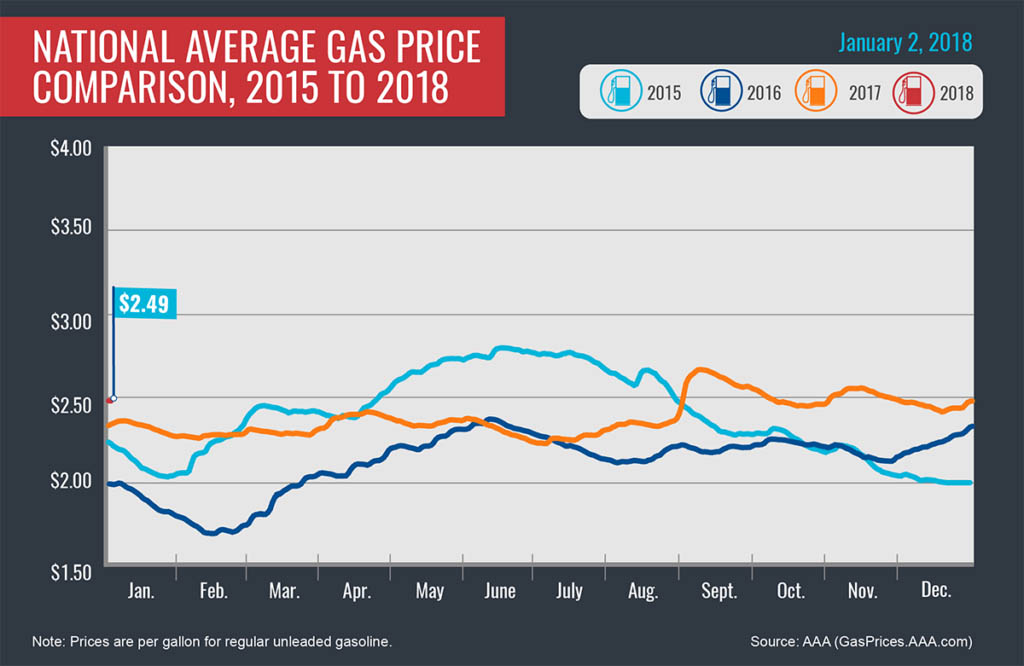
In 2018, the average price of gasoline in the United States hovered around $2.73 per gallon. This figure represents a national average, and prices varied significantly depending on factors such as location, grade of gasoline (regular, mid-grade, premium), and time of year. Let's break down the key influencing factors and regional variations.
Key Specs and Main Price Drivers:
- Crude Oil Prices: The price of crude oil is the single largest determinant of gasoline prices, often accounting for more than 50% of the pump price. In 2018, West Texas Intermediate (WTI) crude oil prices, a benchmark for U.S. oil, averaged around $65 per barrel. Any geopolitical event, like sanctions on oil producing countries, can affect the global supply, thereby influencing crude oil prices.
- Refining Costs and Profits: Crude oil needs to be refined into gasoline, diesel, and other petroleum products. The cost of refining includes energy, labor, and maintenance. Refinery outages, due to planned maintenance or unexpected incidents like hurricanes, can reduce gasoline supply and drive up prices. Refinery profit margins also play a role.
- Distribution and Marketing: Getting gasoline from the refinery to the pump involves transportation via pipelines, tankers, and trucks. Marketing and retail costs include station rent, labor, and advertising. The closer you are to a refining hub, the lower the price will often be.
- Taxes: Federal and state gasoline taxes add a significant amount to the price at the pump. In 2018, the federal gasoline tax was 18.4 cents per gallon. State taxes varied widely, from less than 10 cents per gallon to over 50 cents per gallon.
- Seasonal Demand: Gasoline demand typically peaks during the summer driving season (Memorial Day to Labor Day). Increased demand puts upward pressure on prices. Refineries also switch to producing summer-blend gasoline, which is more expensive to manufacture due to environmental regulations designed to reduce smog.
Regional Variations:
Gasoline prices in 2018 varied considerably across the country. The West Coast, particularly California, typically had the highest prices due to stricter environmental regulations, higher taxes, and limited pipeline access. The Gulf Coast region, home to many refineries, generally had the lowest prices. States in the Midwest and Northeast fell somewhere in between. For example, California averaged closer to $3.50/gallon, while states like Texas sometimes dipped below $2.50/gallon.
How It Works: The Supply Chain
Understanding the gasoline supply chain is essential for understanding price fluctuations. Here's a simplified overview:
- Crude Oil Production: Oil is extracted from the ground (or seabed) by oil producers.
- Transportation: Crude oil is transported to refineries via pipelines, tankers, or rail.
- Refining: At the refinery, crude oil is processed into gasoline and other petroleum products through processes like fractional distillation and cracking. Fractional distillation separates crude oil into different components based on boiling points. Cracking is a process that breaks down larger hydrocarbon molecules into smaller ones, increasing the yield of gasoline.
- Distribution: Gasoline is transported to distribution terminals via pipelines, tankers, or rail.
- Retail: Gasoline is delivered to retail gas stations via trucks.
Any disruption at any point in this supply chain can affect gasoline prices. For example, a hurricane shutting down refineries in the Gulf Coast can cause a temporary spike in prices nationwide.
Real-World Use – Basic Monitoring & Budgeting
Keeping track of gas prices can help you budget effectively and make informed decisions about your vehicle. Here are some basic tips:
- Use Gas Price Apps: Several apps (GasBuddy, AAA) track gas prices in real-time, allowing you to find the cheapest gas stations in your area.
- Track Your Fuel Consumption: Monitor your fuel economy (miles per gallon) and track your driving habits. Aggressive driving, excessive idling, and improper tire inflation can all reduce fuel efficiency.
- Plan Your Trips: Combine errands and avoid unnecessary trips to save on gasoline.
- Consider a Fuel-Efficient Vehicle: If you're in the market for a new car, consider a hybrid or electric vehicle to reduce your dependence on gasoline.
Basic Troubleshooting: If you suddenly notice a significant drop in fuel economy, it could indicate a problem with your vehicle, such as a faulty oxygen sensor, a clogged air filter, or a malfunctioning fuel injector. Get it checked by a qualified mechanic. A delayed oxygen sensor reading will cause the car's computer to attempt to compensate, often by dumping more fuel in than needed.
Safety – Handle With Care!
Gasoline is a highly flammable substance and must be handled with care. Always refuel your vehicle in a well-ventilated area and avoid smoking or using electronic devices. Do not overfill your gas tank. Gasoline vapors are harmful and can cause respiratory irritation. In DIY scenarios involving fuel system components, always disconnect the battery's negative terminal to prevent accidental sparks. Keep a fire extinguisher readily available, and wear appropriate personal protective equipment (PPE), such as gloves and eye protection.
The Diagram (Hypothetical for this example)
We have prepared a detailed diagram illustrating the gasoline supply chain and its impact on prices, including specific data points from 2018. It’s available for download and will give you a visual representation of everything we've discussed.
Purpose: This diagram is a valuable tool for anyone who wants to understand the factors that influence gasoline prices. It can be used for educational purposes, for planning road trips, or for making informed decisions about vehicle purchases and maintenance.
Key Specs and Main Parts: The diagram illustrates the flow of crude oil from production to the pump. It includes key components such as oil wells, pipelines, refineries, distribution terminals, and retail gas stations. It also shows the various costs associated with each stage of the supply chain, including crude oil prices, refining costs, distribution costs, taxes, and marketing costs. The diagram includes average 2018 crude prices and sample margins throughout the process.
Symbols: Lines represent pipelines and transportation routes. Colors represent different types of fuel (e.g., green for gasoline, blue for diesel). Icons represent different types of facilities (e.g., an oil rig for oil production, a refinery for refining). Data points are presented graphically to show fluctuations. Different line weights represent different volumes of flow. The size of icons will show relative capacity, for example, a bigger refinery icon has a greater capacity.
We hope this explanation has been helpful. By understanding the factors that influence gasoline prices, you can make more informed decisions about your vehicle and your budget.